Issue and Options 2023
4. Meeting South Warwickshire's Sustainable Development Needs
Chapter 4 sets out various options as to how we might meet our development needs to 2050 (e.g. infrastructure, jobs and housing). The chapter is split into 2 sections and seeks your views on the following issues:
4.1 South Warwickshire's Development Requirements
- Issue I1: Sustainability Appraisal
- Issue I2: Infrastructure Requirements and delivery
- Issue I3: Community Infrastructure Levy (CIL)
- Issue I4: Infrastructure Safeguarding
- Issue I5: Viability and Deliverability
4.2 Development distribution strategy for South Warwickshire
- Issue S1: Green & Blue Corridors
- Issue S2: Intensification
- Issue S3: Using Brownfield Land for development
- Issue S4: Growth of existing settlements
- Issue S5: The potential for new settlement(s)
- Issue S6: A review of Green Belt boundaries
- Issue S7: Refined Spatial Growth Options
- Issue S8: Small scale development outside of the chosen spatial growth option
- Issue S9: Settlement boundaries and infill development
- Issue S10: Any other development strategy issues
4.1 South Warwickshire's Development Requirements
The primary role of the Local Plan is to promote a sustainable pattern of development that seeks to meet the needs of South Warwickshire, align growth and infrastructure, improve the environment, mitigate climate change and adapt to its effects.
To understand South Warwickshire's development needs a sub-regional Housing and Economic Development Needs Assessment or HEDNA has been undertaken for the Coventry and Warwickshire area, based on up-to-date information from the 2021 census.
The HEDNA provides evidence about how many jobs we should seek to create by 2050 and then how many homes will be needed to house the workers for those jobs. The detail of these requirements is included at Chapters 5 and 6 of this Issues and Options document. However, in order to deliver growth, it is critical that we seek to address the infrastructure implications associated with new development.
Issue I1: Sustainability Appraisal
A Sustainability Appraisal (SA) is an essential component in the production of the Local Plan, informing and influencing plan preparation to optimise its sustainable development performance.
To help ensure that the Local Plan includes the most suitable planning policies and development allocations, the sustainability appraisal identifies, describes and evaluates a number of different reasonable alternative policies and development locations.
An SA has been prepared to support the Issues and Options Consultation which explores the following reasonable alternatives as part of the plan making process:
- 5 Growth Options which provide details about where development should be distributed at a strategic scale across the South Warwickshire area
- 7 New Settlement Locations for large-scale development of not less that 6,000 new homes and associated infrastructure
- 32 Broad Locations which represents options for up to 2,000 homes located around the main settlements for medium scale development and associated infrastructure in any one Broad Location
- 22 Small Settlement locations for intermediate scale development for between 50-500 homes in any one location, typically associated with smaller settlements and villages.
- 88 Policy alternative options for shaping the relevant policies. Subjects include for example climate change, tourism and health.
The appraisal process uses an SA Framework to evaluate how the different reasonable alternatives perform against sustainability objectives. It provides a way in which sustainability effects can be described, analysed and compared.
Evaluation of the Broad Locations, Small Settlements, Growth Options and New Settlements all include a summary of best performing options. At this stage it is difficult to identify stand out best performing options because they all perform best for different SA Objectives and rarely does one option emerge as a best overall option.
It is however possible to begin to identify consistently, poor-performing options and these should be possibly removed from further consideration.
The SA Report is available to view. The SA process will take on board any comments on the SA and use them to furnish the next report with greater detail and accuracy.
Table 1 - SA Key for presenting likely impacts
|
Likely Impact |
Description |
Impact Symbol |
|
Major Positive Impact |
The proposed option contributions to the achievement of the SA Objective to a significant extent. |
++ |
|
Minor Positive Impact |
The proposed option contributions to the achievement of the SA Objective to some extent. |
+ |
|
Negligible Impact |
The proposed option has no effect or an insignificant effect on the achievement of the SA Objective. |
0 |
|
Uncertain Impact |
The proposed option has an uncertain relationship with the SA Objective or insufficient information is available for an appraisal to be made. |
+/- |
|
Minor Adverse Impact |
The proposed option prevents the achievement of the SA Objective to some extent. Mitigation solutions are achievable, and or complex, with a relatively low level of intervention. |
- |
|
Major Adverse Impact |
The proposed option prevents the achievement of the SA Objective to a significant extent. Mitigation solutions are likely to be complex, if at all possible. A high level of intervention is required. |
-- |
(312) Q-I1: Please add any comments you wish to make about the Sustainability Appraisal, indicating clearly which element of the appraisal you are commenting on.
Issue I2: Infrastructure Requirements and delivery
What you said:
The most common concerns relating to infrastructure in South Warwickshire relate to transport, utilities, education, green infrastructure and health facilities and a variety of locations were identified as having particular issues.
Some suggestion that there is the potential for infrastructure issues to be mitigated as well as the Plan to plan positively and seek to overcome infrastructure concerns where development would otherwise bring benefits.
The sufficient provision of infrastructure is an essential element of creating sustainable communities, centred around that which delivers social, environmental and economic objectives. Delivering this infrastructure in a timely manner in order to support new development is important and in some areas there is a view that in the past infrastructure provision has not matched the level of growth and/or not been delivered at the right time.
Current Policy approach
|
Policy document |
Policy reference |
Page no. |
Policy Summary |
|
Warwick District Local Plan |
DS1 |
15 |
Development expected to contribute towards provision of measures to directly mitigate impact and physical, social and green infrastructure to support the needs associated with the development To be provided in a timely manner to support the objectives of the Plan Developer contributions in the form of planning obligations and CIL will contribute towards strategic infrastructure required to support the overall development of the Plan. |
|
Stratford-on-Avon District Core Strategy |
CS.26 |
213 |
Infrastructure, services and community facilities to be put in place to mitigate the impact of development Existing facilities to be retained unless satisfy a number of criteria Open Space and Recreation facilities to be provided in new housing developments. Loss of existing open space to be resisted unless satisfy a number of criteria. |
|
Stratford-on-Avon District Core Strategy |
CS.27 |
219 |
Intention to introduce CIL and continue use of S106 and S278 Agreements for affordable housing and local infrastructure. Infrastructure should be delivered concurrently with or in advance of development and have regard to phasing of housing delivery |
Work with infrastructure providers to date has identified that some of the infrastructure that supports our communities is currently at or nearing capacity. In light of the new growth required across South Warwickshire up to 2050, a review of infrastructure needs is required so that measures can be put in place to ensure that this new growth is supported by appropriate and timely infrastructure. This includes local, strategic and cross-boundary infrastructure requirements.
The Local Plan needs to align infrastructure requirements to the development strategy to ensure that it is truly sustainable, this links directly to the five overarching principles of the Local Plan:
-
Addressing climate change
Supporting renewable and low carbon energy and associated infrastructure is a key aspect of the transition to a low carbon future.
Infrastructure can be used to support the adaptation to climate change effects, such as through the provision of green and blue infrastructure and water management measures. Infrastructure may also be affected by climate change (power, water supply and water quality including sewerage infrastructure, transport etc) and so planning for resilient infrastructure that is able to adapt to future climatic conditions will be necessary.
-
Promoting wellbeing
The provision of health and education facilities, along with affordable housing is critical to the success of achieving sustainable communities.
Heritage and cultural assets can have a significant impact on a sense of place and the character of the area, engendering a sense of belonging. It is therefore important to ensure that these facilities are considered when development takes place, and can include both built assets and also the provision of outdoor spaces for cultural engagement where appropriate.
Developments can provide for a wide range of infrastructure that can promote healthy, inclusive and safe places. This can include the provision of pedestrian and cycle connections within and between neighbourhoods, high quality public space, safe and accessible green infrastructure, sport and recreation facilities, local shops, meeting places, access to healthier food and allotments.
Development also provides the opportunity to improve air quality or mitigate impacts such as through traffic and travel management, and green infrastructure provision and enhancement. -
Improving connectivity
Development proposals need to provide for appropriate transport infrastructure and consider the opportunities from existing or proposed transport infrastructure particularly those in relation to walking, cycling and public transport.
Advanced, high quality and reliable communications infrastructure is essential for economic growth and social well-being. -
Increasing biodiversity
The Green and blue Infrastructure network across South Warwickshire has multiple benefits and the need to create, maintain and enhance these networks of habitats and green/blue infrastructure is critical.
Seeking the creation, conservation, restoration and enhancement of priority habitats through new development, and identifying and pursuing opportunities for securing measurable net gains for biodiversity is a way of achieving this. -
Creating well-designed and beautiful place
Design quality is an important component of the infrastructure that makes a place and includes both that relating to individual buildings and the spaces and places between them including the potential for public art. Preserving and enhancing our existing built and natural assets is also an important role of new development.
Infrastructure Delivery
Aligning infrastructure needs to new development is a key objective of the Local Plan and work is ongoing with a wide range of infrastructure providers to enable this. Infrastructure to support new development can be provided in a variety of ways through the planning process depending on the circumstances:
- On-site directly by the infrastructure provider as a requirement of an individual planning permission – e.g. digital communications, energy, water, roads, cycleways, access to public transport
- On-site incorporated into the design of the development by the developer – e.g. renewable and low carbon energy, green infrastructure, affordable housing, design quality
- Off-site through the provision of financial developer contributions to pay for the provision of infrastructure to be provided elsewhere – e.g. education, health facilities, biodiversity restoration
To maximise the ability to secure and deliver infrastructure from new developments all three mechanisms will need to be applied. The first two mechanisms require policies to establish the requirement for which infrastructure is to be required for different types, scales and locations of development in order to make it acceptable.
The third approach requires a system of developer contributions to be in operation to set, calculate, collect and spend financial contributions. The current system utilises a combination of S106 Planning Obligations and the Community Infrastructure Levy (CIL). S106 Planning Obligations are also used to secure some on-site infrastructure such as open space and affordable housing.
S106 Planning Obligations are sought on developments to mitigate the impact of an otherwise unacceptable development to make it acceptable in planning terms, and need to be directly related to the development itself and in scale and kind to it.
Whilst there may be some potential for the use of public sector funding, for example through the West Midlands Combined Authority (WMCA) and the government's Shared Prosperity fund, the expectation is that the main source of funding will come from developer contributions.
(182) Q-I2: Please select the option which is most appropriate for South Warwickshire
Issue I3: Community Infrastructure Levy (CIL)
The Community Infrastructure Levy (CIL) is intended to fund generalised infrastructure requirements across the District in order to support new development. It is a mechanism to secure financial contributions from developers on certain viable developments and can be used to fund the provision, improvement, replacement, operation or maintenance of infrastructure to support the development of the area.
Both Councils currently operate a system of S106 and CIL contributions. Through the Levelling Up and Regeneration Bill the Government is intending to replace the current system of developer contributions with a new ‘Infrastructure Levy’; the precise details of this are still to be announced and the Local Plan will reflect these changes as preparation of the Plan progresses.
(165) Q-I3: Please select the option which is most appropriate for South Warwickshire
To support the infrastructure requirements set out within the Local Plan, an Infrastructure Delivery Strategy will be prepared which will set out the key pieces of new infrastructure and the climate resilience of infrastructure needed to deliver the Plan and how this will be delivered. It will be necessary to ensure that developer contributions do not undermine the deliverability of the Plan, to this end the Plan will be informed by robust delivery and viability studies to assess the impact of infrastructure requirements.
Issue I4: Infrastructure Safeguarding
The current local plans seek to safeguard land to help facilitate the delivery of a number of key infrastructure projects across South Warwickshire.
Other infrastructure projects may also come to the fore through the plan making process for the SWLP, and these will be considered in the context of the overarching objectives of the plan.
Stratford-on-Avon District
Land has been safeguarded in the Core Strategy in respect of the following proposals subject to the business case being made and funding secured.
- M42 Widening – land either side of Junction 3a to help reduce congestion where the M40 joins the M42
- A46 Improvements – proposal, should funding allow, to widen the stretch of the A46 between the Wildmoor junction at Stratford-upon-Avon and Oversley Hill Farm, on the outskirts of Alcester
- Portabello Crossroads – improvements to this junction between the A429 Fosse Way and the B4035 to the west of Shipston-on-Stour
- Stratford to Honeybourne former railway – safeguarding the route of the former railway south of Stratford-upon-Avon to Honeybourne to facilitate re-opening
- Western Road to Birmingham Road, Stratford-upon-Avon – proposal for new crossing of the canal and creation of a new route between the A3400 Birmingham Road and A422 Alcester Road
- Bridgeway Gyratory Improvements – widening of key town centre route that takes traffic from town centre/A439 onto the Clopton Bridge and south across the River Avon
- West of Shottery Relief Road – currently under construction as part of the West of Shottery development connecting B439 Evesham Road with the A46 at Wildmoor
- Stratford South Western Relief Road – a third crossing of the River Avon to the south-west of Stratford-upon-Avon, connecting A3400 Shipston Road with B439 Evesham Road
Emerging Site Allocations Plan:
A46 Safeguarding – draft proposals to safeguard land at the Bishopton and Wildmoor junctions to facilitate improvements to the A46 should they be deemed necessary.
Warwick District
- Park and Ride Areas of Search – the adopted Local Plan identifies 'areas of search' for a potential park and ride facility to the north of Leamington Spa.
Both Districts
- High Speed Rail 2 (HS2) - will run through the district and is currently under construction. Land has been safeguarded for the route, and space required for the construction process.
Current adopted policy
|
Policy document |
Policy reference |
Page no. |
Policy Summary |
|
Stratford-on-Avon District Core Strategy |
CS.26 |
213 |
Part D and the Policies map safeguards eight areas of land to facilitate transport improvements across the District. There is a presumption against development that would prejudice the implementation of any scheme. |
|
Warwick District Local Plan |
TR4 & TR5 |
90-95 |
TR4 seeks to safeguard land of HS2 and areas of search for park and ride. TR5 ensures the safe operation of aerodromes. |
(165)
Q-I4.1: Should we include a policy to safeguard specific infrastructure schemes within the SWLP?
Q-I4.2: Please add any comments you wish to make about these specific safeguarding provisions
Issue I5: Viability and Deliverability
The development strategy for South Warwickshire needs to be both deliverable and viable, which means that there is a sufficient level of confidence that the sites and locations identified for growth are able to come forward and deliver all that is required of them in terms of necessary infrastructure provision.
All of the sites considered for development as part of the growth strategy will be assessed through the South Warwickshire Housing and Economic Land Availability Assessment (HELAA) to assess their availability, suitability and viability for development. Additionally, an Infrastructure Delivery Strategy and associated viability assessments will be undertaken as the Local Plan progresses to ensure that what is put forward as a preferred development strategy is both deliverable and viable.
(198) Q-I5: Please add any comments you wish to make about infrastructure, viability and deliverability
4.2 Development distribution strategy for South Warwickshire
This Part One Local Plan needs to identify the overarching development strategy for the delivery of the required growth across South Warwickshire in a way that satisfies the vision and objectives of the Plan, and this strategy will then act as a framework for subsequent plans and strategies and inform the determination of planning applications for new development. Whilst it is anticipated that this Part One Plan will set out the development principles and associated infrastructure requirements for the broad locations that are identified, it is expected that Part 2 Plans (for example Area Action Plans, Masterplans, topic-based Development Plan Documents) will provide more detail on these strategic locations and also set out the development principles and detail on the more non-strategic locations identified for growth.
A Topic Paper is available, "Evolving the Spatial Growth Options – the story so far", setting out the evolution of the Spatial Growth Options to date.
A range of factors need to be considered to identify a suitable pattern of growth as each will influence the overall strategy:
- Green & Blue Corridors
- Making efficient use of land
- Using Brownfield Land for Development
- The potential for new settlement(s)
- Growth of existing settlements
- A review of Green Belt boundaries
Issue S1: Green & Blue Corridors
What you said:
- Overwhelming support for the protection and enhancement of our green areas and associated habitat/biodiversity. However, it was acknowledged that a balance needs to be struck between the need for development and the protection of the local environment
- Ancient woodland should be protected and retained and there was support for the planting of trees
- Green open space and woodland should be easily accessible to the local community as they provide a valuable asset for health and wellbeing, as well as benefits for nature.
- Policies should have regard and be in line with any relevant, existing and forthcoming national policies
Green & blue infrastructure is an important aspect of planning for many reasons, and protecting and enhancing existing networks, as well as creating new ones are high on the agenda, especially following the release of the Governments 25 Year Environment Plan and the new Environment Act, both of which aim to halt natures decline and to support its recovery.
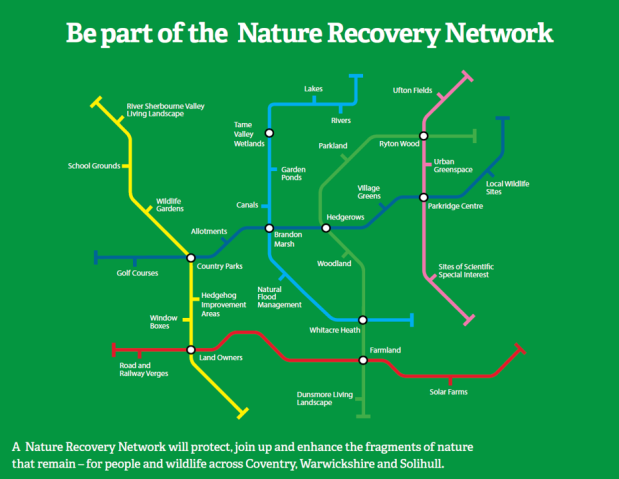
Green Infrastructure, as defined within the NPPF, is 'a network of multi-functional green and blue spaces and other natural features, urban and rural, which is capable of delivering a wide range of environmental, economic, health and wellbeing benefits for nature, climate, local and wider communities and prosperity'. Green & blue Infrastructure can be incorporated into development at varying scales and in many forms, such as through the planting of street trees, creating parks, providing private gardens, allotments, sustainable urban drainage systems, wildlife areas, woodlands, natural flood management schemes, hedgerows, field margins and waterways, to name a few. Used in conjunction these can all help improve the provision of green & blue infrastructure across the plan area and create a Nature Recovery Network (Figure 7), resulting in benefits for people, nature and the climate. The SWLP will address the incorporation of green & blue Infrastructure assets in development as the plan progresses, and it is likely that there will be a separate policy on green infrastructure within Part 2 of the South Warwickshire Local Plan. However, this section focuses on the creation of a strategic green & blue infrastructure network primarily for wildlife, one that seeks to improve the biodiversity of the area, supports natures recovery and allows wildlife to travel across large areas.
Designated natural assets, including Sites of Special Scientific Interest, Local Wildlife Sites, Ancient Woodland and Local Nature Reserves, as well as non-designated assets such as woodlands/forests, river networks, and country parks, can all contribute to a strategic green corridor network. However, these assets and areas may not link together in a way that allows wildlife to travel between them, and in order to create a biodiverse and environmentally resilient South Warwickshire this is something the South Warwickshire Local Plan will need to address.
Figure 7 – The Wildlife Trusts' Nature Recovery Network illustrative diagram
On a regional scale, in accordance with the new Environment Act, the production of a Local Nature Recovery Strategy will help South Warwickshire plan, map and act, in a way that supports this. However, it is likely to be many years before a finalised Nature Recovery Strategy is in place, and it would likely be adopted after the SWLP growth strategy has been determined. With the emphasis on the climate emergency and increasing biodiversity, it is important that the SWLP growth strategy supports natures recovery as best it can, and does not detrimentally impact some of the key natural assets across the area. As such, it is proposed that the SWLP takes a proactive approach and seeks to identify its own 'Green Corridors' across the plan area in advance of the Local Nature Recovery Strategy, so that they can inform the growth strategy. Establishing a network of green corridors at this stage of the plan making process will help determine a growth strategy that increases biodiversity and supports natures recovery.
Local Nature Recovery Strategies are a new system of spatial strategies that will establish priorities and map proposals for specific actions to drive nature's recovery and provide environmental benefits.
In advance of a Local Nature Recovery Strategy being created the existing Warwickshire Coventry and Solihull Sub-regional green infrastructure study (2013) can be used to inform green infrastructure policies, and the creation of a green & blue infrastructure network. An update to this study is scheduled and is anticipated to take place within the next few years, however, the information within the existing study is still valuable and can be used alongside additional evidence to help determine where Green Corridors across the plan area could go.
Current Adopted Policy
|
Policy document |
Policy reference |
Page no. |
Policy Summary |
|
Stratford-on-Avon District Core Strategy |
CS.5 |
44 |
As part of the Landscape policy, the Core Strategy seeks to protect the quality of ancient semi-natural woodland and aged/veteran trees, and where proposals affect trees and hedgerows measures are taken to protect their contribution to landscape character, public amenity and biodiversity. Where appropriate trees are included in development schemes and opportunities are taken to expand native woodlands and to buffer/extend/connect fragmented ancient woodlands. Woodlands planted to reduce flood risk, and help climate change adaptation are also encouraged. |
|
Stratford-on-Avon District Core Strategy |
CS.6 |
48 |
Development is expected to contribute towards a resilient ecological network, support ecosystems and provide ecological security for wildlife, people, the economy and tourism. Proposals will be expected to minimise impacts on biodiversity and where possible secure a biodiversity net gain through measures such as safeguarding and enhancing existing habitats, and making provision for additional habitats, helping strengthen networks and addressing the priorities of the Biodiversity Action Plan. |
|
Stratford-on-Avon District Core Strategy |
CS.7 |
53 |
The existing green infrastructure network will be promoted through the principles of protection, enhancement, restoration and creation, and new development proposals must demonstrate their contribution to the green infrastructure network. Open spaces, waterways and other green infrastructure features will be maintained and improved, and access to these features will be provided. |
|
Warwick District Local Plan |
HS6 |
99 |
Development proposals are required to provide access to high quality and safe green or open spaces. |
|
Warwick District Local Plan |
NE1 |
117 |
The Council will protect, enhance and restore the district's green infrastructure assets and strive for a healthy integrated network for the benefit of nature, people and the economy. Working with partners the council will protect and enhance existing habitats, as well as restoring fragmented areas, ensure access to natural green space and make improvement to landscape character. |
|
Warwick District Local Plan |
NE2 |
118 |
The Council will protect designated areas and species of national and local importance for biodiversity and geodiversity such as Sites of Special Scientific Interest (SSSIs) Ancient Woodland, aged and veteran trees, Local Nature Reserves and Local Wildlife Sites |
|
Warwick District Local Plan |
NE4 |
120 |
New development will be permitted that positively contributes to landscape character. Development proposals will be required to demonstrate that they: g) address the importance of habitat biodiversity features, including aged and veteran trees, woodland and hedges and their contribution to landscape character, where possible enhancing these features through means such as buffering and reconnecting fragmented areas; |
(205) Q-S1: Please select the option which is most appropriate for South Warwickshire
Issue S2: Intensification
Density relates to how much built development there is in a given area. It plays an important role in determining how a place looks and functions, and the extent to which it contributes towards the long-term sustainability of the site, locality and the wider area. National policy requires planning policies to promote an effective use of land in meeting the development needs of an area.
The SWLP team have produced a density guide which illustrates typical housing densities found within the South Warwickshire Area.
Increasing the number of homes within existing urban areas is known as 'intensification' or 'densification'.
You told us:
There was strong support for intensification as it supports the re-use of brownfield land and is strongly encouraged by national policy. It provides a number of benefits such as tackling climate change, reducing travel and promoting active travel.
Most respondents felt that intensification shouldn't be considered in isolation as it wouldn't meet the need for new growth alone and there is a potential impact on the environment and heritage assets that would need to be considered.
There was some suggestion that there should not be a blanket approach across South Warwickshire as densities should be different in urban and rural areas, and that the individual location should determine the appropriate density taking into account the identified need, local market conditions, viability and the availability of transport and other infrastructure and services.
There was some suggestion that there should be minimum density standards for the area outside of town centres and there may need to be a range of densities to reflect individual areas.
Reference was made to the importance of design in high density development to maintain existing character and ensure high quality development. Space standards are also an important consideration.
Intensification of existing urban areas can have a positive impact on the sustainability of the settlement by:
- Positioning dwellings close to existing jobs and services, creating walkable neighbourhoods
- Improving the viability of public transport
- Improving the viability of existing town centres and the services within them
- Reducing the need for 'greenfield' land for development
Intensification also has an important role to play in tackling climate change both in relation to reducing carbon emissions and creating places that are more resilient to the effects of climate change. It can reduce reliance on the private car by making destinations more easily accessible by walking or cycling. This brings together higher concentrations of people to support local public transport and other services and facilities, thereby reducing the need to travel and shifting travel onto low-carbon modes. Additionally, higher density developments can often achieve higher levels of energy efficiency by improving the viability of decentralised energy schemes.
Well-designed intensification recognises and draws on the existing strengths and heritage of an area. When done well, intensification can have a positive impact on the appearance and vitality of a neighbourhood. Building at higher densities can often deliver higher quality developments, although it is often associated with negative perceptions from examples of poor urban design. Density is just one aspect of built form; building height, block size and building typology will all affect the character and the perceptions of density.
Intensification can be achieved in a number of number of ways, for example:
- Re-using brownfield sites
- Conversion of upper floors of buildings to residential use
- Additional storeys on buildings
- Re-using empty homes
- Infill in residential areas, e.g. filling gaps in the street frontage, developing disused garage blocks, car parks
- Mews dwellings on service roads
Current adopted policy
|
Policy document |
Policy reference |
Page no. |
Policy Summary |
|
Stratford-on-Avon District Core Strategy |
CS.20 |
115 |
Subdivision of dwellings and conversions to residential use supported in principle. Provision of flats above shops supported in principle. |
|
Warwick District Local Plan |
TC3 |
46 |
Within town centre retail areas, changes of use from retail to other uses not permitted (including on upper floors) |
|
Warwick District Local Plan |
TC14 |
52 |
Within town centres, changes of use from residential to other uses not permitted on upper floors |
(195) Q-S2: Please select all options which are appropriate for South Warwickshire
Issue S3: Using Brownfield Land for development
Brownfield land is that which has been previously developed. Reusing suitable brownfield land for new development can provide an effective use of land and reduces the need for development on previously undeveloped greenfield sites. National policy places great emphasis on the efficient use of urban land – it is a key component of sustainable development and can help to tackle the climate emergency. Identifying the potential of existing urban areas to accommodate additional residential development is an important component of the growth strategy for South Warwickshire.
Brownfield Land suitable for redevelopment could consist of industrial estates that have fallen out of use, buildings that have fallen into disrepair, or simply parcels of already developed land that could be used in a more efficient way. Small parcels of brownfield land are most commonly found within existing built-up areas, however sometimes large areas of rural brownfield land, such as airfields in the countryside, can become available. In some instances, redeveloping brownfield land, means clearing the site of existing buildings, however, sometimes the most efficient and most climate friendly approach is to incorporate existing buildings into new development proposals so that they can be reused, repurposed and retrofitted to achieve net zero carbon requirements.
What you said:
- Support for directing development to brownfield sites as these locations are likely to have infrastructure in place and can also be suitable locations for densification, which has sustainability benefits. Such an approach also reduces the need to develop greenfield land. It was however acknowledged that there may be costs for remediation works and this may have impacts on viability.
- Concern that the loss of businesses on brownfield land, due to housing redevelopment, can affect SMEs by raising costs.
- Concerns that brownfield sites may struggle to provide green infrastructure (e.g green open spaces & trees) due to site constraints, and blanket approaches can often impede development.
An Urban Capacity Study for South Warwickshire has recently been undertaken to inform the Local Plan. Its purpose is to identify the potential for residential development on brownfield land within the settlements in South Warwickshire that have been identified as the most sustainable in terms of access to services and facilities in the existing adopted Stratford Core Strategy and Warwick Local Plan.
The study has been undertaken as a theoretical exercise and is not intended to conclusively establish the urban capacity of South Warwickshire over the period to 2050, but rather to indicate potential untapped urban capacity within these identified settlements, subject to the application of policy and the conclusions of more detailed subsequent evidence work. The Study does not consider the implications on existing infrastructure, for example education, health, transport. More detailed assessments of the individual sites will need to be undertaken to consider their suitability and deliverability, along with the effect on existing infrastructure and whether any negative impacts can be appropriately mitigated for, such as the provision of additional infrastructure.
(347) Q-S3.1: Please add any comments you wish to make about the Urban Capacity Study
Current Adopted Policy
|
Policy document |
Policy reference |
Page no. |
Policy Summary |
|
Stratford-on-Avon District Core Strategy |
AS.11 |
199 |
Prioritise re-use of brownfield land. Small scale brownfield redevelopment is encouraged in line with AS.10 Countryside and Villages. Redevelopment of large rural brownfield sites are also encouraged outside the green belt however, a number of factors need to be considered to minimise any adverse impacts. This includes: making sure development is in the local/national interest, whether there is a more suitable location in line with the development strategy, whether development would be an improvement on the current use, the scale and nature of the impacts on the local area, any statutorily protected features, ability to support sustainable travel and any areas of flood risks. |
|
Warwick District Local Plan |
DS10 |
21 |
The spatial strategy seeks to maximise the use of brownfield sites, with nearly 9% of allocated housing sites utilising Urban Brownfield land. |
(240) Q-S3.2: Please select the option which is most appropriate for South Warwickshire
Issue S4: Growth of existing settlements
- South Warwickshire has a dispersed settlement pattern and is home to a significant number of existing settlements of varying sizes. There are nine towns (Alcester, Henley-in-Arden, Kenilworth, Royal Leamington Spa, Shipston-on-Stour, Southam, Stratford-upon-Avon, Warwick and Whitnash), at least 82 villages and hundreds of hamlets.
The South Warwickshire Local Plan will seek to maximise the capacity of its existing urban areas in order to meet our development needs to 2050 (see Issue S2). However, in deciding upon the best distribution strategy for new development within South Warwickshire it is important for the Local Plan to consider the potential for growth around the edges of the existing settlements, potentially alongside and in combination with other options such as new settlements (see Issue S5).
South Warwickshire's existing towns and villages provide varying levels of services and facilities to meet the needs of the people who live or work in and around them. Some of the larger settlements act as a hub for surrounding smaller villages. The facilities available can range from healthcare, education, leisure & recreation, retail, jobs and places to meet, and how well located they are to public transport options. Chapter 10 Issue T1 highlights the benefits of the 20-minute neighbourhood principle whereby people are able to meet their regular day to day needs within reasonable walking distance of their home or workplace. The 20 minutes relates to a 10-minute walk to the facility and then a 10-minute walk back. This concept very much follows the objective of sustainable development and aligns with the overarching principles of this Local Plan.
In rural areas, the implementation of the 20-minute neighbourhood poses a different set of challenges, including poor broadband and mobile phone coverage, inferior public transport provision and road transport, and a poor variety of employment opportunities. Housing affordability and isolation from and access to services are other issues facing many rural areas. There are two possible approaches to these rural settlements:
- Market Towns of sufficient size to become a complete and compact 20-minute neighbourhood, where people from nearby villages would need to travel to the town to use its services to find most of what they need for everyday life rather than having to travel to several different places. This is a concept that could be taken forward in Neighbourhood Development Plans.
- Areas with small villages and no towns could create a network of villages that collectively provide what most people need for their daily lives, joined by active travel arrangements.
In order to understand the situation within our existing settlements as to whether there is potential for new development to help deliver the advantages of a 20-minute neighbourhood, a settlement analysis evidence base has been developed to help us identify the opportunities and constraints to growth in and around the edges of the following settlements and locations across South Warwickshire. These have been selected based on their status in the existing Local Plans and those that fell within certain growth options.
Table 2 – List of settlements and locations subject to connectivity, accessibility and density analysis
|
Alcester |
Hatton Station |
South of Coventry |
|
Barford |
Henley-in-Arden |
Southam |
|
Bearley |
Kenilworth |
Stratford-upon-Avon |
|
Bidford-on-Avon |
Kineton |
Studley |
|
Bishop's Tachbrook |
Kingswood (Lapworth) |
Warwick |
|
Claverdon |
Long Itchington |
Wellesbourne |
|
Cubbington |
Radford Semele |
Whitnash |
|
Earlswood |
Royal Leamington Spa |
Wilmcote |
|
Hampton Magna |
Salford Priors |
Wood End |
|
Hatton Park |
Shipston-on-Stour |
Wootton Wawen |
Whilst acknowledging that there are other factors to be considered in relation to the potential for growth that are outside the scope of this specific study, the analysis provides a useful assessment of:
- Connectivity – the physical connectivity of the existing street pattern, and any physical barriers which limit route/connection options, including green & blue infrastructure.
- Accessibility – this element focuses on the proximity/distance to key facilities and services
- Density – an analysis of the density ranges within the settlement
Connectivity Analysis
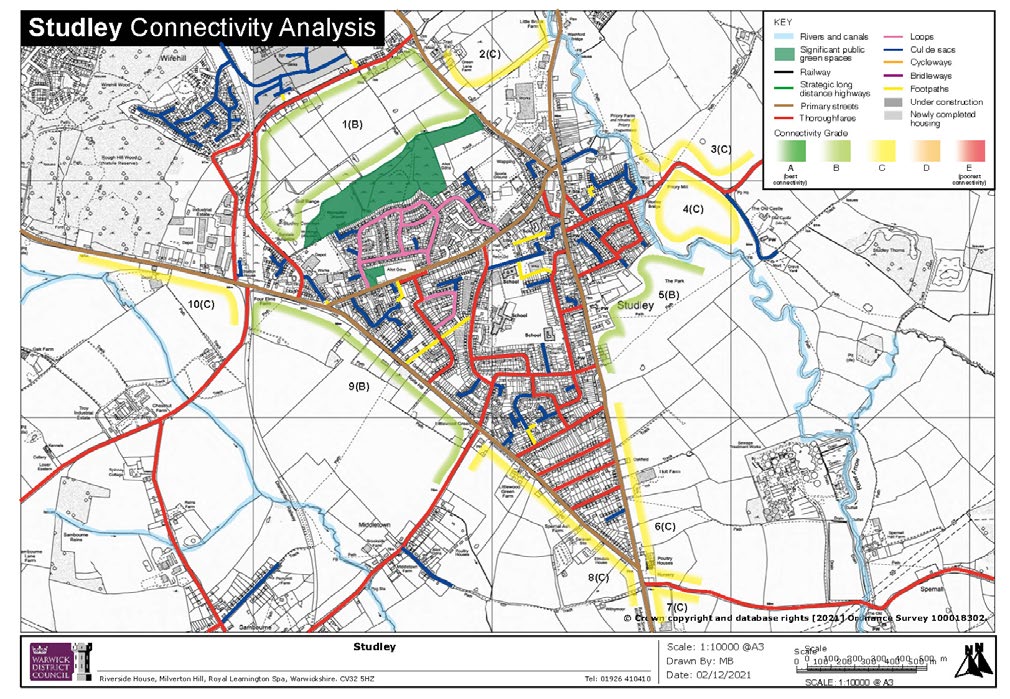
The streets and other connectors (e.g. footpaths) have been considered and categorised/mapped as in the example in figure 8 below. These categories suggest the extent to which the route is connected to others within the network. For example, a cul de sac (blue) is only connected at one end to another street, and is therefore less connective than a primary street (brown). This mapped analysis gives an overall illustration of connectivity within the settlement as a whole.
Figure 8 – Example Settlement Connectivity Analysis – Studley
Landform Analysis
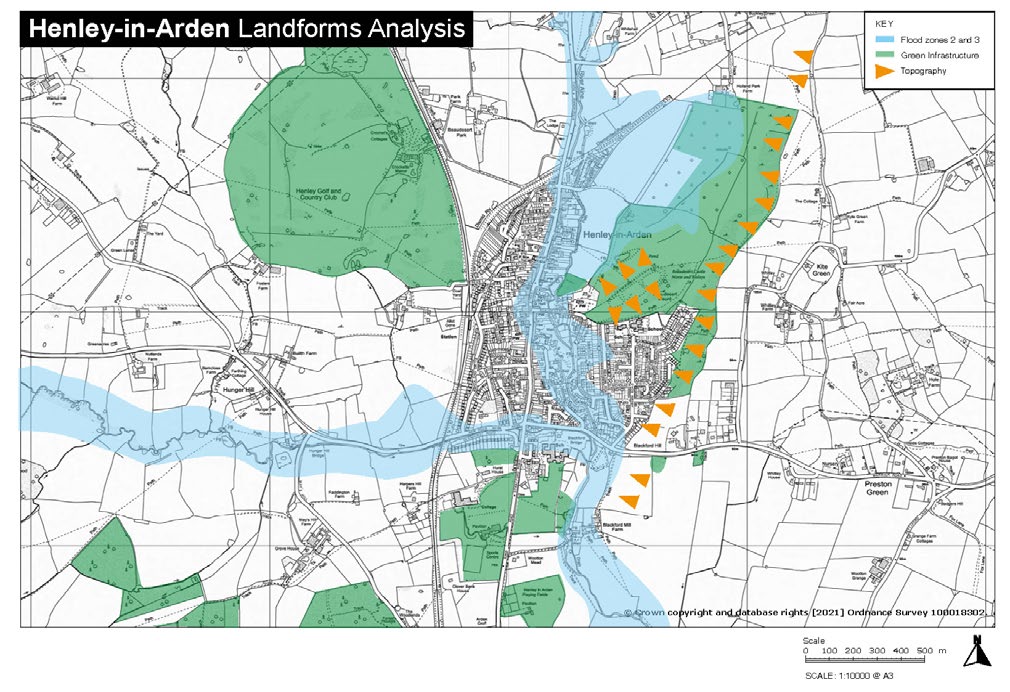
Landform analysis principally considers the location and form of green infrastructure, flood zones, and notable slopes/topography. All of these elements potentially pose opportunities or constraints to how people can move around a settlement, and linked to that, how a settlement might grow. Figure 9 below is an example of landform analysis.
Figure 9 – Example Settlement Landforms analysis – Henley-in-Arden
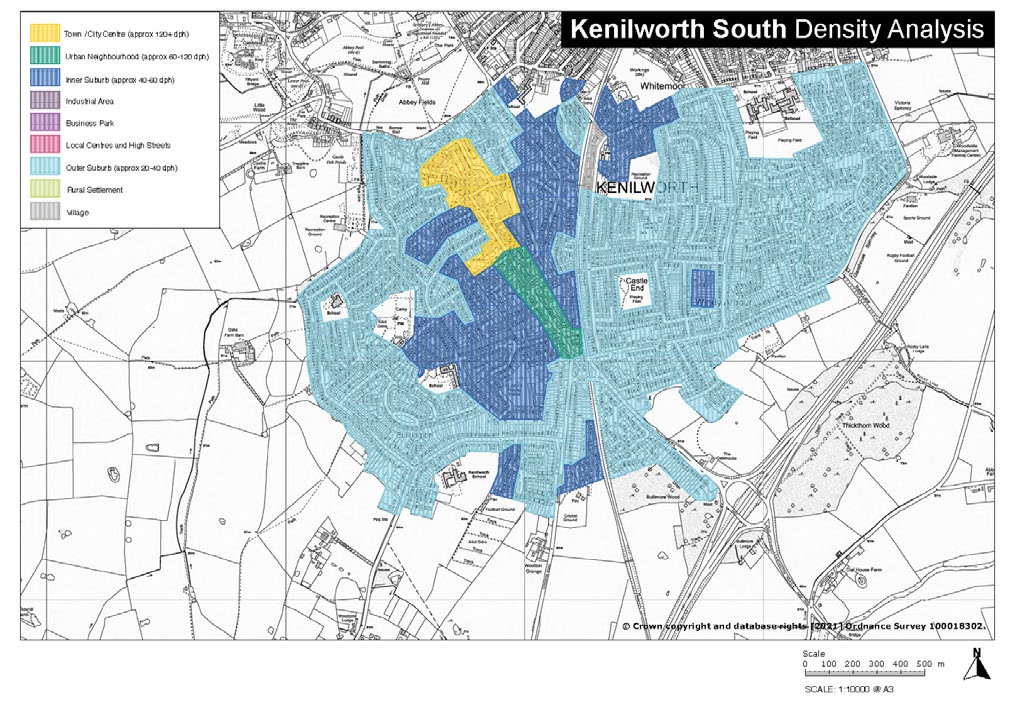
Density Analysis
The density analysis gives an indication of the prevailing densities across different settlements. These could inform assumptions about typical density ranges that may be appropriately applied to any growth in the locality if relevant to spatial options, and therefore the approximate capacity of different areas of land.
For the purposes of this work (e.g. figure 10), precise densities were not calculated for each area, rather areas were defined through officer observation and a judgement of the 'best fit' within the density range definitions in the National Model Design Code (p13-14).
Figure 10 – Example Settlement Density analysis – Kenilworth South
Sustainability Appraisal (SA)
To help ensure that the Local Plan includes the most suitable planning policies and development allocations, the SA identifies, describes and evaluates a number of different reasonable alternative policies and development locations. Further information on the SA and a question to provide any comments on can be found in Section 4.1.
Included within the SA is an exploration of a number of alternative options, including those that involve the growth of existing settlements:
- 32 Broad Locations which represents options for up to 2,000 homes located around the main settlements for medium scale development and associated infrastructure in any one Broad Location
- 22 Small Settlement locations for intermediate scale development for between 50-500 homes in any one location, typically associated with smaller settlements and villages
Details of the SA assessments of these locations can be found in section 4 and appendix B (Broad Locations) and section 5 and appendix C (Small Settlements).
Heritage and Settlement Sensitivity Assessment
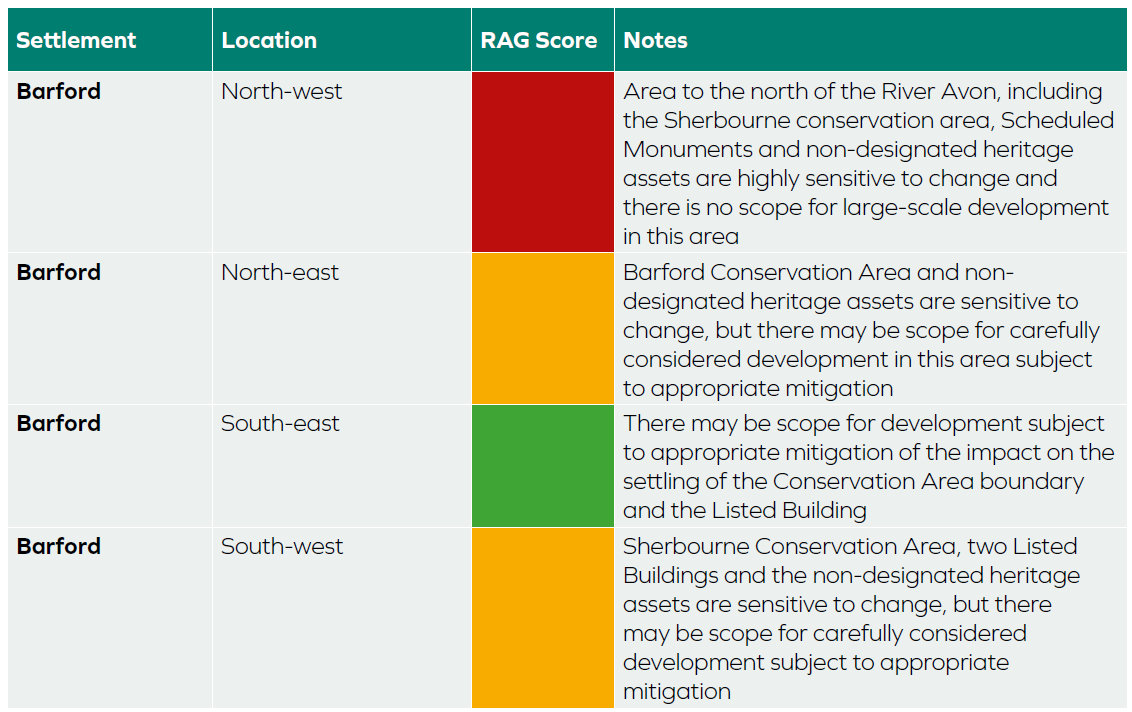
In addition to the above analysis, a Heritage and Settlement Sensitivity assessment has been undertaken for the same settlements across South Warwickshire that assesses the sensitivity to new development on the existing heritage and landscape character. The purpose of the study is to gain an understanding of each settlement's historic and landscape value, sensitivity, opportunities for enhancement and capacity to accommodate new development around the edge of the existing settlement. The assessment uses a Red Amber Green (RAG) rating to provide recommendations on the edges of the settlements. An example of the assessment for the settlement of Barford is presented in Figure 11.
Figure 11 – Example Heritage and Settlement Sensitivity assessment – Barford
(484)
Q-S4.1: Do you think that growth of some of our existing settlements should be part of the overall strategy?
Q-S4.2: Please add any comments you wish to make about the settlement analysis, indicating clearly which element of the assessment and which settlement(s) you are commenting on
Issue S5: The potential for new settlement(s)
What you said:
37% of respondents supported the principle of new settlements, whilst 27% were against. The remainder were indifferent.
Reasons for support: potential to ensure infrastructure is provided in a timely manner, and potential to locate them near existing transport infrastructure
Reasons for not supporting new settlements included timing of delivery/commencement and slow build outs
New settlements can be an effective and sustainable way of meeting the challenges of delivering high-levels of housing growth. Whilst it is acknowledged that large-scale development will transform the landscape of the specific area in which it is built, it provides many benefits including a range of new community, employment, and leisure services. At the same time, focusing significant development in new locations can relieve pressure on other areas thus helping to retain their special character and qualities. Many of these places are our existing larger villages and historic market towns. An added benefit is that because of their scale, necessary infrastructure and employment premises can be built in from the beginning helping to ensure that they create or contribute to sustainable communities as well as ensuring a holistic approach when it comes to infrastructure delivery.
New Settlements are one of several options being considered to deliver the necessary growth required over the plan period.
Regarding timescales, one of the benefits of having a plan that runs to 2050 is that it provides adequate time for a new settlement to come on stream.
For a new settlement to be considered, it is imperative to establish the minimum number of homes necessary to deliver and sustain new infrastructure and ensure a viable development, from both a financial and community perspective. Discussions with infrastructure and service providers are ongoing but initial feedback has provided the following thresholds for three key facilities as set out in Table 3. Other facilities and services would be provided onsite. These figures are minimum figures and the likeliness is that there will need to be a greater number of homes to ensure that new settlements are viable and can sustain new infrastructure.
Table 3 – Infrastructure thresholds
|
Infrastructure |
Threshold |
|
Primary School |
1,000 – 2,000 homes |
|
Secondary School |
4,000 – 5,000 homes |
|
Railway Station |
6,000 homes |
Based on a net density of 40 dwellings per hectare and taking into account the need for land for open space, schools, employment and retail, the area of land required would be in excess of 250 hectares, equivalent to over 600 football pitches.
In order to narrow down the search for potential locations, the following two-part methodology has been devised.
Part 1 – Identifying Areas of Search
Given the climate change emergency, as a starting point we think it is right to start the search for a new settlement in locations that have or could have (subject to further detailed discussions with rail operators) easy access to rail services.
We have split the South Warwickshire rail network into seven areas of search labelled A-G as shown on Figure 12, below. The seven areas are simply based on the rail corridors outside of existing urban areas.
Part 2 – Identifying Potential Locations
A very high-level initial assessment has been undertaken of the seven areas of search encompassing the following considerations:
- Green Belt
- Conservation Areas
- Special Landscape Areas
- Ancient Woodland
- Sites of Special Scientific Interest
- Railway Stations
- Strategic Road Network
- Coalescence
Within the seven Areas of Search, seven potential locations have been identified. A summary of this assessment is shown in Table 6. Two Areas of Search (D and G) do not contain any potential locations.
It should be stressed that in order to take forward any potential location, further detailed assessment is required. This assessment would include any major constraints and consider possible mitigation and will take place following the Issues and Options consultation. There is the possibility that once these detailed assessments have taken place and in light of any comments received to the Issues and Options consultation, none of the potential locations are deemed suitable.
Sustainability Appraisal (SA)
To help ensure that the Local Plan includes the most suitable planning policies and development allocations, the SA identifies, describes and evaluates a number of different reasonable alternative policies and development locations. Further information on the SA and a question to provide any comments on can be found in Section 4.1.
Included within the SA is an exploration of a number of alternative options, including those that involve the potential locations for new settlements.
Details of the SA assessments of these locations can be found in section 6 and appendix D.
Table 4 – High level sustainability appraisal of New Settlement Locations
|
New Settlements |
A1 |
B1 |
C1 |
E1 |
F1 |
F2 |
F3 |
|
SA Objective 1 Climate change |
-- |
-- |
-- |
-- |
-- |
-- |
-- |
|
Objective 2 Flood risk |
+ |
+ |
+ |
- |
+ |
- |
- |
|
Objective 3 Biodiversity |
-- |
- |
-- |
-- |
-- |
-- |
-- |
|
Objective 4 Landscape |
-- |
- |
- |
- |
- |
-- |
- |
|
Objective 5 Cultural Heritage |
-- |
-- |
-- |
0 |
-- |
-- |
- |
|
Objective 6 Pollution |
- |
- |
- |
- |
- |
- |
- |
|
Objective 7 Natural Resources |
-- |
-- |
-- |
-- |
-- |
-- |
-- |
|
Objective 8 Waste |
-- |
-- |
-- |
-- |
-- |
-- |
-- |
|
Objective 9 Housing |
++ |
++ |
++ |
++ |
++ |
++ |
++ |
|
Objective 10 Health |
- |
- |
- |
- |
- |
- |
- |
|
Objective 11 Accessibility |
- |
- |
- |
- |
- |
- |
- |
|
Objective 12 Education |
- |
- |
- |
- |
- |
- |
- |
|
Objective 13 Economy |
+ |
+ |
+ |
+ |
+ |
+ |
+ |
Climate Change Emissions Estimation
As part of the evidence to inform the Local Plan an operational carbon model has been developed to assess carbon emissions at a strategic level and test how the development of the seven potential new settlement locations performs against each other. Each option is modelled as a scenario where various levers and inputs reflect different policy and design decisions and changes in the market. The model is based on current Government and existing Local Plan policies and the results of the scenario modelling give a better understanding of which levers will have the greatest impact on future carbon emissions of each growth option.
The model has been built in a flexible manner to allow more detailed data to be easily added at future stages of the preparation of the Local Plan. This could include additional site specific information, emerging policy direction at each stage of the Plan and other or updated sources of information such as further data released from Census 2021 – like travel mode split.
Table 5 shows the cumulative and year on year annual emissions for the seven potential new settlement options. This analysis highlights the critical importance of the growth options in terms of estimating overall carbon emissions for new settlements, with those within growth option 4 - Sustainable Travel & Economy generally performing better in terms of reduced carbon emissions. Overall, this provides a useful overview and starting point to consider refining options, with the potential for future policies to deliver wider carbon benefits to the development of these new settlements across all the growth areas. Further information on the Estimation of Emissions study is available to view.
An erratum has been published to the Estimation of Emission Study, and also to table 5 of this Issues and Options document where the data source was the Emissions study.
Table 5 – New settlements location and summary emissions estimations
|
Location |
New Settlement Reference |
Growth Options considered |
Cumulative emissions in 2050 (tCO2e) |
Annual emissions in 2050 (tCO2e) |
|
Henley-in-Arden |
A1 |
2 – Sustainable Travel 3 – Economy 4 – Sustainable Travel & Economy |
440,000 446,000 432,000 |
2,500 2,500 2,400 |
|
Hatton Station |
B1 |
1 – Rail Corridors 2 – Sustainable Travel 4 – Sustainable Travel & Economy |
437,000 440,000 432,000 |
2,500 2,500 2,400 |
|
Kingswood |
C1 |
1 – Rail Corridors |
437,000 |
2,500 |
|
Depper's Bridge |
F2 |
1 – Rail Corridors 2 – Sustainable Travel 4 – Sustainable Travel & Economy |
437,000 440,000 432,000 |
2,500 2,500 2,400 |
|
Long Marston Airfield / Meon Vale |
E1 |
1 – Rail Corridors 2 – Sustainable Travel 3 - Economy 4 – Sustainable Travel & Economy 5 - Dispersed |
437,000 440,000 446,000 432,000 464,000 |
2,500 2,500 2,500 2,400 2,700 |
|
Wood End |
F1 |
1 – Rail Corridors 3 - Economy |
437,000 446,000 |
2,500 2,500 |
|
GLH Gaydon / Lighthorne Heath |
F3 |
3 - Economy 4 – Sustainable Travel & Economy |
446,000 432,000 |
2,500 2,400 |
(53) Q-S5.1: Please provide any comments you have on the emissions estimation modelling for the seven potential new settlement options?
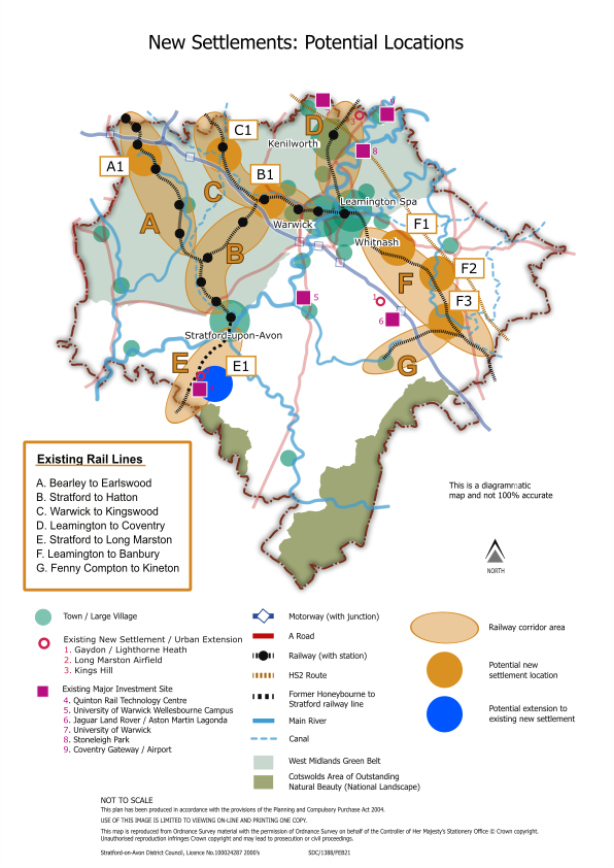
Table 6 – Summary of potential locations for a new settlement
|
Potential location |
Green Belt |
Conservation Area |
Special Landscape Area |
Ancient Woodland |
SSSI |
Existing railway station |
Would require new railway line/station |
SRN (Strategic Road Network) |
Would this result in coalescence with existing settlements? |
|
A1 |
 |
(part) |
|
(part) |
 |
(Wood End)(Danzey Green) |
|
Western part of site adjacent to A435 connecting to M42. |
|
|
B1 |
 |
 |
|
|
|
(Hatton) |
|
M40 to the west of proposed area and A4177 to the north. |
|
|
C1 |
|
|
|
|
|
(Lapworth) |
|
M40 to the south of proposed area. |
|
|
D |
- |
- |
- |
- |
|
- |
- |
- |
- |
|
E1 |
|
|
|
|
|
|
|
B4632 runs through part of the proposed area. (Approx. 7 miles to the A46). |
|
|
F1 |
|
|
|
|
One to the east and one to the south of proposed area |
|
(new station) |
Fosse Way runs to the west of proposed area. (M40 Junction 12 approx. 4 miles away). |
|
|
F2 |
|
|
|
Area to south east of the proposed area. |
|
|
|
B4451 runs to the north of the proposed area. M40 approx. 3 miles away. |
|
|
F3 |
|
|
|
Area to the north |
|
|
(Would require a new station complete with accompanying railway and access infrastructure) |
B4100 runs to the eastern edge of the site. Nearest junction to M40 would 12 at Gaydon (approx. 4 miles away). |
|
|
G |
- |
- |
- |
- |
- |
- |
- |
- |
- |
(368)
Q-S5.2: Do you think new settlements should be part of the overall strategy?
Q-S5.3: In response to the climate change emergencies, we are looking at rail corridors as a preferred approach to identifying potential locations. Do you agree?
Q-S5.4: If not, what approach would you take?
Issue S6: A review of Green Belt boundaries
What you said:
54% of respondents supported the exploration of growth opportunities in the Green Belt, with 31% against and the remaining 15% commenting without giving an overall view.
Main reasons given for support:
- Opportunity for provision of affordable housing in Green Belt settlements
- Enables growth to have adequate provision of supporting infrastructure
- There is demand from growth in the economy and the population
- Opportunity to focus on development sites which do not harm the green belt
- Opportunity to create sustainable patterns of development
- The large extent and tightness of the existing designation
- Length of time since the green belt was established and need to be revised
- Suggested by the Greater Birmingham and Black Country HMA Strategic Growth Study 2018
- Varied ecological and landscape value in some green belt areas not worthy of protection
- Need a blended approach to growth
- Opportunity to focus growth adjacent to existing settlements in the green belt
- Enables focussed assessment of the green belt for the five purposes
- Plan needs to be underpinned by a comprehensive green belt review in line with the NPPF
Main reasons given against:
- Setting a precedent
- Need to protect it for future generations
- Some views that this would not constitute sustainable development
- Some views that the green belt contributes to biodiversity and climate change aims
- The role of the green belt has not changed since it was designated
- Focus should be on brownfield and urban development first
- Contradicts the overarching principle of the Local Plan
- Should be increasing green belt instead
- Would damage the character of the area
- Impact of HS2 already on the green belt so should not exacerbate the impact
- Future potential for National Park designation
- It has a role in people's health and wellbeing
- Already been loss of green belt in neighbouring areas
- Available land outside the green belt
- Plan should not be developer led
- Should not be the easy option to addressing development needs
- Non-green belt sites in sustainable locations should be prioritised
Figure 13 shows the extent of the existing Green Belt in South Warwickshire, covering the land to the north of Alcester, Stratford-upon-Avon and Royal Leamington Spa.
It includes some of the larger settlements such as Alcester, Henley-in-Arden, Cubbington and Kenilworth, and the majority of the area's railway stations with several lines running through the area covered by Green Belt. Additionally, part of the area's Canal and River network run through this area. Settlements within the existing Green Belt are some of the most closely located and connected of all the settlements within South Warwickshire to the West Midlands conurbation and the services and facilities that are available.
Figure 13 - Green Belt across South Warwickshire
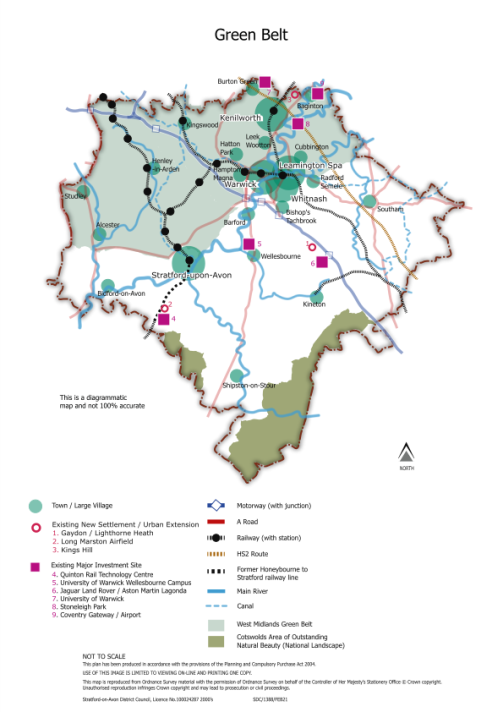
The area of Green Belt within South Warwickshire is part of the wider West Midlands Green Belt, and there are five purposes of Green Belt designation which are set out in national policy:
- To check the unrestricted sprawl of large built-up areas
- To prevent neighbouring towns merging into one another
- To assist in safeguarding the countryside from encroachment
- To preserve the setting and special character of historic towns
- To assist in urban regeneration by encouraging the recycling of derelict and other land
Current Adopted Policy
|
Policy document |
Policy reference |
Page no. |
Policy Summary |
|
Stratford-on Avon District Core Strategy |
CS.10 |
69 |
The purposes of the Green Belt will be upheld by resisting inappropriate development within it, except in cases where very special circumstances are justified in accordance with the provisions of national policy. |
|
Warwick District Local Plan |
DS.18 |
31 |
The Council will apply national planning policy to proposals within the green belt. |
This Local Plan provides an opportunity to consider whether the existing Green Belt boundaries should be altered to allow for development in certain areas currently within it. National policy states that this can only be done where exceptional circumstances are fully evidence and justified. This would include demonstrating that all other reasonable options for meeting the development needs have been explored, including the use of brownfield land, optimising density and engaging with neighbouring authorities about accommodating any development needs. The need to promote sustainable patterns of development can contribute towards establishing a case for exceptional circumstances.
Optimising the use of brownfield land and densities are policy areas discussed elsewhere within this consultation document, and dialogue is ongoing with neighbouring authorities about meeting the sub-region's development needs.
In identifying locations for development across South Warwickshire including those currently within the Green Belt, the need to address climate change and deliver a sustainable pattern of development is a critical factor.The location and spread of the Green Belt in South Warwickshire may mean that limiting growth to locations outside of the existing Green Belt designation may not be the most sustainable or climate friendly option as it pushes development away from areas that are well connected with good infrastructure and better access to facilities and services towards areas with more limited infrastructure and where further travel would be necessitated.
In the Scoping and Call for Sites consultation in 2021 there was a majority support for undertaking a review of Green Belt boundaries:
Additionally, stakeholder engagement undertaken in summer 2022 on strategizing potential growth options for South Warwickshire overwhelmingly supported exploring the potential for reviewing Green Belt boundaries to consider options for growth on the basis that it might deliver the most sustainable development strategy for South Warwickshire.
A review of the Green Belt across South Warwickshire is an important piece of evidence to underpin the approach taken in the Local Plan. It would consider whether there are any areas which no longer meet all five of the Green Belt purposes and could be removed to allow for the most sustainable development to come forward, including the provision of affordable housing and employment opportunities. Such a review could also look at the potential to add new areas of Green Belt where the five purposes are met. It would provide a transparent approach to enable all options for future development to be fully considered and scrutinised before a preferred strategy is taken forward.
For this reason, and at this early stage in refining the range of growth options that could deliver the most sustainable form of development in South Warwickshire, the approach taken has been 'blind' to whether a particular location or corridor is in the Green Belt.
This has resulted in all/some of the spatial growth options including an element of growth located within the Green Belt in order to achieve the required outcome. Information on how the growth options have evolved from the 2021 Scoping Consultation is available in the Spatial Growth Options Topic Paper "Evolving the Spatial Growth Options – the story so far".
To achieve a growth strategy that addresses the vision and strategic objectives for the Plan, a Green Belt study to review the existing Green Belt boundaries would inform and help to refine the growth options that are set out within this Issues and Options consultation to enable a preferred approach for South Warwickshire to be established. This would complement other studies that are being prepared to inform the Local Plan, such as housing capacity, green infrastructure and landscape, heritage and economic and infrastructure needs. Together, these studies will provide a comprehensive evidence base to appraise and arrive at a sustainable pattern of development that meets the Plan's objectives.
Issue S7: Refined Spatial Growth Options
What you said:
- Of the 7 high-level growth options set out in the Scoping Consultation, the 'most preferred' was based around rail (21%)
- Of the 7 high-level growth options set out in the Scoping Consultation, the least preferred was based around the road network (9%)
- Circa 38% of respondents advocated for a hybrid approach to options. Rail, bus and enterprise options were most commonly identified to form part of a hybrid
One of the key things the South Warwickshire Local Plan will provide is a "spatial development strategy". This is a strategy which determines how much growth will be directed to different locations in South Warwickshire, to provide for our needs to 2050. The aim is to provide homes, jobs, green spaces and other infrastructure in the most suitable and sustainable places. For example, finding the locations where people can most effectively integrate into existing communities or create self-sufficient new communities; access employment, education and the services they need; live healthy lives; and minimise dependence on the private car. The strategy needs to be robust and flexible, in order to be of value for the whole plan period.
Current Adopted Policy
|
Policy document |
Policy reference |
Page no. |
Policy Summary |
|
Stratford-on-Avon District Core Strategy |
CS15 |
83 |
The spatial growth strategy as set out in this policy is based on a pattern of balanced dispersal primarily focussing on the main town of Stratford-upon-Avon, a number of Main Rural Centres and small Local Service Villages, two new settlements and a range of large rural brownfield sites. |
|
Warwick District Local Plan |
DS4 and H1 |
17 and 64 |
Focuses development within and adjacent the built up areas with the majority at Warwick, Leamington, Whitnash and Kenilworth and the southern edge of Coventry, with some development in identified Growth Villages and Limited Infill Villages. |
The previous round of consultation (the Scoping Consultation) presented seven potential spatial growth options. These options were focussed on: Rail Corridors; Main Bus Corridors; Main Road Corridors; Enterprise Hubs; Socio Economic; Main Urban Areas; Dispersed.
Officers have considered the responses to the Scoping Consultation, and other emerging evidence. This includes undertaking Settlement Analysis work, and conducting a range of stakeholder workshops during the summer of 2022. This has led to an evolution of the potential spatial growth strategies. Further details of this evolution process can be seen in the topic paper "Evolving the Spatial Growth Options – the story so far". The outcomes of the stakeholder workshops can be seen in the report "Spatial Growth Strategy Workshop Outcomes".
Five growth options are presented in this Issues and Options Consultation. Some of the spatial growth options presented here are brought forward directly from the Scoping Consultation, while others are hybrids of one or more options.
- Option 1: Rail Corridors
- Option 2: Sustainable Travel
- Option 3: Economy
- Option 4: Sustainable Travel and Economy
- Option 5: Dispersed
Further details of each option can be seen below.
At this stage, to fully consider all options, the spatial growth options are presented with Green Belt policy "off" - i.e. all five options include some Green Belt locations. Decisions on whether to take land out of the Green Belt are interlinked with the selection of a growth option, and the balance of Green Belt and non-Green Belt locations varies between growth options. The issue of Green Belt boundaries is discussed in the section "A Review of Green Belt Boundaries".
An initial analysis of each of the spatial growth options has been conducted through both the Sustainability Appraisal and the Climate Change emissions testing assessments. Both of these evidence sources are available to view on our technical evidence webpage. We will be using the outputs of these assessments, along with other evidence, to inform our Preferred Spatial Growth Option as the Local Plan progresses.
Sustainability Appraisal (SA)
To help ensure that the Local Plan includes the most suitable planning policies and development allocations, the SA identifies, describes and evaluates a number of different reasonable alternative policies and development locations. Further information on the SA, the key used for the assessment table and a question to provide any comments can be found in Section 4.1.
Included within the SA is an exploration of a number of alternative options, including each of the 5 spatial growth options. Table 7 below sets out a summary of the analysis, further detail of the SA assessments of these locations can be found in section 6 and appendix D.
Conclusions of the high level assessment of the Spatial Growth Options that are not all distinct from each other, with the exception of Option 5, means that sustainability performance can only be evaluated with several caveats. These include the fact that detailed locational information is not available and the ability to identify effects with precision is challenging. The scores in Table 7 are strictly a guide and do not represent a diagnostic analysis. Mitigation has not been factored into the performance of the Growth Options since it is best worked up once more detailed locational information is available.
Different options are likely to perform better for certain SA Objectives than others. With this in mind an overall best performing option is hard to identify. Option 5 is the worst performing Option whilst Option B is likely to align most closely with development that will ultimately seek the most effective mitigation against climate change. These options will also deliver better performance in respect of pollution and natural resource impacts since they are both slightly more concentrated that Options 3 and 4. However, whilst they perform positively for employment and economy, Options 3 and 4 are best in this respect. Without further detail, all options perform the same for waste and housing.
Table 7 – High level sustainability appraisal of Spatial Growth Options
|
Spatial Option |
1 |
2 |
3 |
4 |
5 |
|
Description |
Rail Corridors |
Sustainable Travel |
Economy |
Sustainable Travel and Economy |
Dispersed |
|
SA Objective 1: Climate change |
- |
- |
- |
- |
-- |
|
Objective 2: Flood risk |
0 |
0 |
0 |
0 |
0 |
|
Objective 3: Biodiversity |
+/- |
- |
- |
- |
-- |
|
Objective 4: Landscape |
- |
+ |
- |
- |
+ |
|
Objective 5: Cultural Heritage |
+/- |
+/- |
+/- |
+/- |
+ |
|
Objective 6: Pollution |
+ |
+ |
+/- |
+/- |
+/- |
|
Objective 7: Natural Resources |
+ |
+ |
- |
- |
0 |
|
Objective 8: Waste |
- |
- |
- |
- |
- |
|
Objective 9: Housing |
++ |
++ |
++ |
++ |
++ |
|
Objective 10: Health |
+/- |
+/- |
+/- |
+/- |
-- |
|
Objective 11: Accessibility |
++ |
+ |
- |
+ |
-- |
|
Objective 12: Education |
+/- |
+/- |
+/- |
+/- |
- |
|
Objective 13: Economy |
+ |
+ |
++ |
++ |
- |
Climate Change Emissions Estimation
As part of the evidence to inform the Local Plan an operational carbon model has been developed to assess carbon emissions at a strategic level and test how the development of the five growth options performs against each other. Each growth option is modelled as a scenario where various levers and inputs reflect different policy and design decisions and changes in the market. The model is based on current Government and existing Local Plan policies and the results of the scenario modelling give a better understanding of which levers will have the greatest impact on future carbon emissions of each growth option.
The model has been built in a flexible manner to allow more detailed data to be easily added at future stages of the preparation of the Local Plan. This could include additional site specific information, emerging policy direction at each stage of the Plan and other or updated sources of information such as further data released from Census 2021 – like travel mode split.
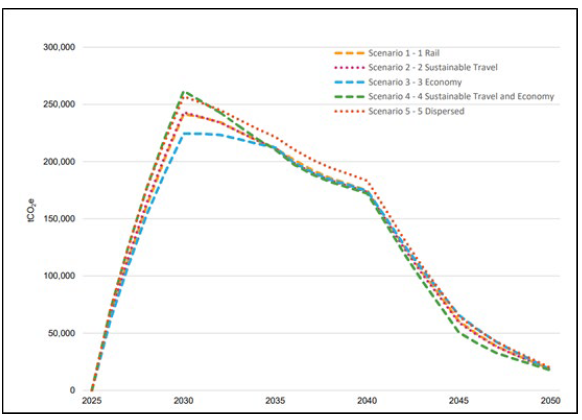
Figures 14 and 15 show the cumulative and year on year annual emissions for the five potential growth options. From this we can determine that the Sustainable Travel & Economy growth option resulted in the lowest final annual emissions in 2050 compared with the alternative options, whilst the Dispersed option has the highest emissions compared with the alternatives. Despite having the lowest annual emissions in 2050, cumulative emissions for the Sustainable Travel & Economy growth are higher in 2050 than many other growth options. This is due to the Sustainable Travel & Economy growth option's emissions peaking higher than all other options in 2030. The total area under this emissions pathway curve is therefore greater than many of the other growth options resulting in higher cumulative emissions by 2050.
Further information on the Estimation of Emissions study is available.
Figure 14 – Cumulative emissions comparison (tCO2e)
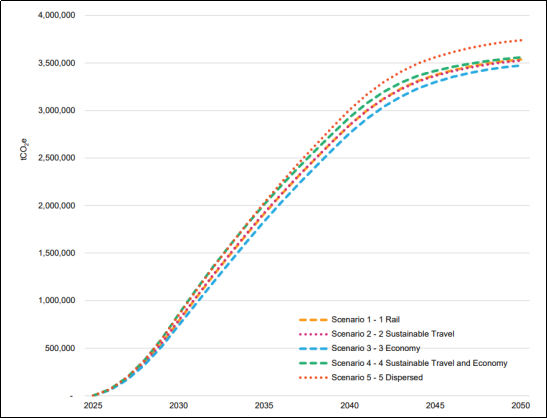
Figure 15 – Annual emissions comparison (tCO2e)
(65) Q-S7.1: Please provide any comments you have on the emissions estimation modelling for the five growth options
The spatial growth options will further evolve through the plan process, narrowing down to a single option which will be presented in the "Preferred Options" consultation. This further evolution will be influenced by a range of evidence, including: responses to this consultation; Carbon Emissions assessments, Sustainability Assessments, Urban Capacity Study, Green Infrastructure Strategy, Heritage Assessments, Green Belt Study, Strategic Flood Risk Assessment, Water Cycle Strategy, Strategic Transport Assessment for all modes (includes traffic modelling), Landscape Character Assessments, and land availability.
The maps and named locations shown here indicate approximate locations within each option where growth might feasibly happen. This includes settlements or locations considered to be within active-travel distance of key features such as a rail station or major employment site. The inclusion or exclusion of a particular location is not intended as a firm commitment, and other locations not indicated might fit within a particular growth strategy.
In particular, some of the strategies include growth at the scale of a new settlement. This is not intended to pre-judge the outcomes of new settlement work – see section "The Potential for New Settlement(s)". No detailed analysis of individual sites or land availability has yet happened, so all potential growth locations should be taken as broad indications rather than firm proposals.
Option 1 – Rail corridors
Option 1 is brought forward from the Scoping Consultation. This focusses growth in rail corridors, particularly around existing railway stations, but also anticipating the possibility of new or re-opened stations on existing lines, or re-opening closed lines. Focussing housing and employment growth around railway stations can contribute to sustainable development, by giving residents and employees sustainable travel options, reducing dependence on road transport.
However, most of the existing railway stations in South Warwickshire lie within or close to the West Midlands Green Belt, and consequently this growth option would require the release of a significant amount of Green Belt land.
South Warwickshire's railway stations are not evenly spread over the area, and many are in very small settlements. As well as growth directed to larger settlements, this growth option sees many of these small settlements taking moderate growth (say a few hundred dwellings each) which would noticeably impact on their current rural character. The cumulative effect over a wider area could also be significant. In addition, perhaps four locations would need to take growth at the scale of a new settlement (say 6,000 dwellings or more) – and the viability of each individual new settlement could be compromised if they are clustered too closely together. To some extent this issue could be tackled by reducing the number of new settlements and increasing their size.
It should be noted that at this stage in the plan-making process, no detailed feasibility work has been undertaken around the capacity of existing rail infrastructure or the potential for enhanced or new services. There may be locations identified in these growth options where rail improvements are found not to be feasible, or where the existing capacity could support only limited growth. Further work will be undertaken as the growth options are further refined.
The new settlement locations shown in this option are indicative and should not be taken as firm proposals.
Indicative list of settlements and locations that may feature in Option 1:
Bearley, Claverdon, Cubbington, Depper's Bridge, Grey's Mallory, Hampton Magna / Warwick Parkway, Hatton Station, Henley-in-Arden, Kenilworth, Kingswood (Lapworth), Leamington Spa, Long Marston Airfield, Radford Semele, South of Coventry – Kings Hill, Stratford-on-Avon, Wilmcote, Wood End, Wootton Wawen.
Figure 16 – Option 1 - Rail Corridors
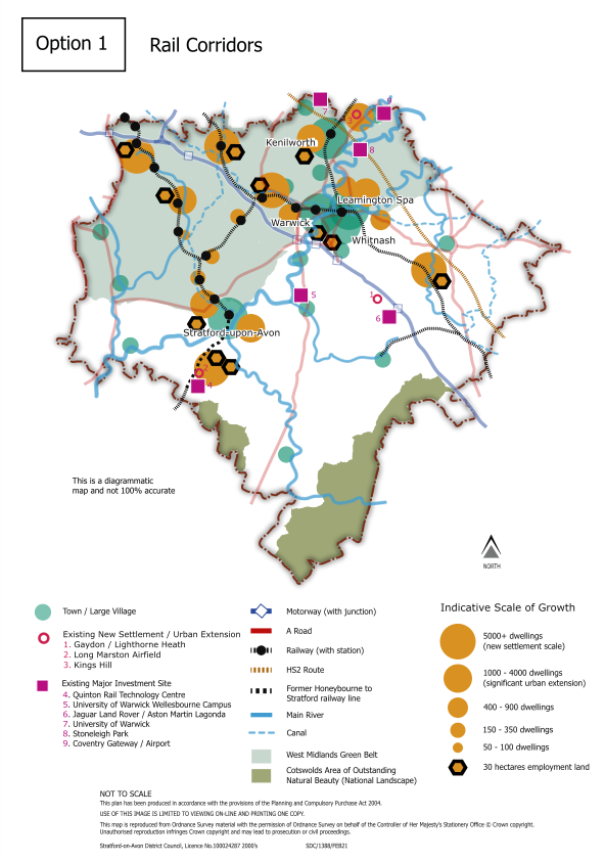
Option 2 – Sustainable Travel
Option 2 is a hybrid of the rail corridor and main bus corridor options presented in the Scoping Consultation. It aims to build on the strengths of Option 1, while recognising that in many parts of South Warwickshire, bus travel is the only viable public transport option. Utilising the main bus corridors relieves some of the pressure on Green Belt land, shifting the balance of growth away from the North and West of the South Warwickshire area.
When compared to Option 1, this option results in development at fewer of the smaller settlements that have railway stations, and there are fewer developments at the scale of a new settlement. As a broad indication, the map suggests two new settlements on railway lines, but as with Option 1, the new settlement locations are indicative and should not be taken as firm proposals.
Building on main bus corridors is, of course, based on the road network. This could be seen as a less sustainable option if new residents and employees do not choose to use the bus service. However, by positioning new development on main bus corridors, people are provided with the choice.
Within this option, there are also question marks around the best way to support bus travel in South Warwickshire. The approach taken here aims to strengthen existing bus routes by placing potential new users on well-served corridors. An alternative approach would be to use development to 'plug the gaps', where significant numbers of new residents and employees could encourage new or improved bus services to areas that are currently poorly served.
At this stage in the plan-making process, no detailed feasibility work has been undertaken around the capacity of existing bus and rail infrastructure or the potential for enhanced or new services. There may be locations identified in these growth options where bus or rail improvements are found not to be feasible, or where the existing capacity could support only limited growth. Further work will be undertaken as the growth options are further refined.
Indicative list of settlements and locations that may feature in Option 2:
Alcester, Bidford-on-Avon, Bishop's Tachbrook, Cubbington, Depper's Bridge, Grey's Mallory, Hampton Magna / Warwick Parkway, Hatton Station, Henley-in-Arden, Kenilworth, Leamington Spa, Long Marston Airfield, Mappleborough Green / East of Redditch, Radford Semele, Shipston-on-Stour, South of Coventry – Kings Hill, Stratford-on-Avon, Studley, Wellesbourne.
Figure 17 – Option 2 – Sustainable Travel
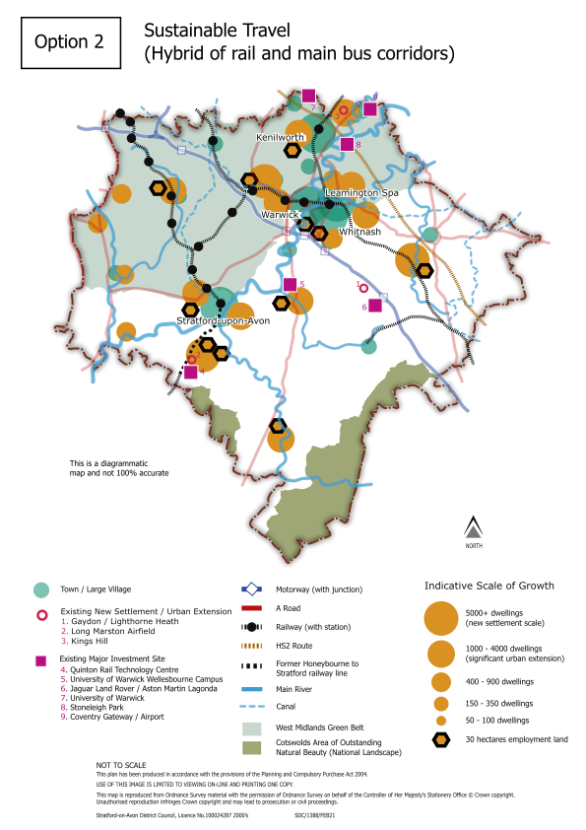
Option 3 – Economy
Option 3 is a hybrid of the socio-economic and enterprise hubs growth options presented in the Scoping Consultation. This option aims to locate homes close to existing jobs and potential new job locations; and to tackle socio-economic disadvantage through the benefits development can bring. These benefits could be in the form of Developer Contributions towards infrastructure, and providing affordable housing.
A growth option where jobs and homes are co-located means that more people are given the option of living close to their place of work. Shorter journeys mean that active travel options are more appealing and are more likely to be chosen as a feasible way of getting to work.
Many businesses are reliant on the strategic road network for transporting products, and realistically this is unlikely to change significantly in the near future. Putting housing development close to enterprise hubs does therefore mean that people may still choose to use private cars as the main way they get around. An employment location well connected on the strategic highway network might mean people simply choose to commute by car rather than living close to their place of work.
In this option, growth at new settlement scale is focussed close to existing motorway junctions. The locations of these new settlements are indicative and should not be taken as firm proposals.
Proximity to employment locations is only one aspect of sustainability, and this option does suggest growth in some smaller settlements that would otherwise not be considered sustainable locations, when taking into account the range of facilities and services available in each settlement.
Indicative list of settlements and locations that may feature in Option 3:
Alcester, Baginton, Barford, Bidford-on-Avon, Bishop's Tachbrook, Bubbenhall, Cubbington, Gaydon / Lighthorne Heath, Grey's Mallory, Hampton Magna / Warwick Parkway, Henley-in-Arden, Kenilworth, Leamington Spa, Long Marston Airfield, Long Itchington, Salford Priors, Shipston-on-Stour, South of Coventry – Westwood Heath, Southam, Stoneleigh, Stratford-on-Avon, Wellesbourne, Wood End, Wootton Wawen.
Figure 18 – Option 3 – Economy (Hybrid of socio-economic and enterprise hubs)
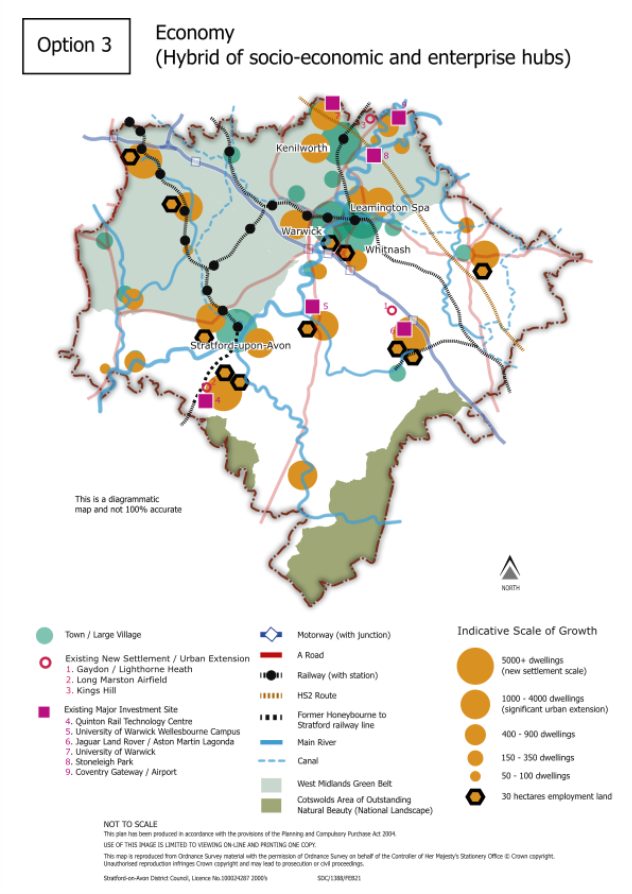
Option 4 – Sustainable Travel and Economy
Option 4 is a hybrid of options 2 and 3. It aims to take the best aspects of each, to address the main aims of each individual option. The broader focus of this option allows the selection of the most suitable locations that fall within each individual option, while avoiding many of the 'second choice' locations that inevitably arise when working within a highly constrained growth option.
This option provides a balance of growth at existing main settlements, some growth at new settlement scale on the rail lines, and more modest growth in smaller settlements, which can contribute to enhancing the viability of village centres and provide affordable housing.
The growth in this option is balanced between Green Belt and non-Green Belt locations, but even so it should be recognised that it relies on the release of significant amounts of Green Belt land.
At this stage in the plan-making process, no detailed feasibility work has been undertaken around the capacity of existing bus and rail infrastructure or the potential for enhanced or new services. There may be locations identified in these growth options where bus or rail improvements are found not to be feasible, or where the existing capacity could support only limited growth. Further work will be undertaken as the growth options are further refined.
As with other options, new settlement locations are indicative and should not be taken as firm proposals.
Indicative list of settlements and locations that may feature in Option 4:
Alcester, Bidford-on-Avon, Bishop's Tachbrook, Cubbington, Depper's Bridge, Gaydon / Lighthorne Heath, Grey's Mallory, Hampton Magna / Warwick Parkway, Hatton Station, Henley-in-Arden, Kenilworth, Leamington Spa, Long Marston Airfield, Long Itchington, Mappleborough Green / East of Redditch, Radford Semele, Salford Priors, Shipston-on-Stour, South of Coventry – Kings Hill, Southam, Stratford-on-Avon, Studley, Wellesbourne.
Figure 19 – Option 4 – Sustainable Travel and Economy
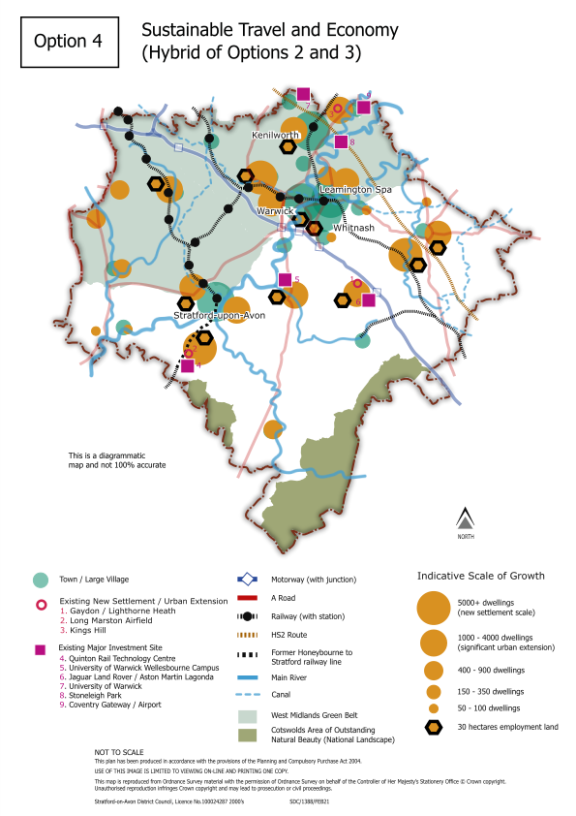
Option 5 – Dispersed
Option 5 is brought forward from the Scoping Consultation. Dispersal of growth to a wider range of locations can mean that the amount of growth in individual settlements is reduced, but with a higher number of settlements taking some growth.
Dispersing growth can enhance the vitality of individual settlements, bringing in new customers to rural facilities, and providing affordable housing. However, it is harder to provide new or upgraded infrastructure to a dispersed population.
Dispersing growth would not help encourage sustainable travel, as many of the new homes would inevitably be poorly connected by public transport, and long distances from the facilities needed for day-to-day life.
Within this option there are many ways that growth could be dispersed. Settlements would be categorised to reflect the range of facilities currently present and their current population size. This would then determine how much growth is considered appropriate in each location. The distribution shown on the map shows one way this might be achieved.
The pattern of dispersal follows existing settlements, and consequently there is a balance of Greenbelt and non-Greenbelt land required. This option also includes modest growth in a number of settlements within the Cotswolds National Landscape AONB.
Indicative list of settlements and locations that may feature in Option 5:
Alderminster, Alcester, Alveston, Ardens Grafton, Aston Cantlow, Avon Dassett, Baddesley Clinton, Baginton, Barford, Bearley, Beausale, Bidford-on-Avon, Binton, Bishop's Tachbrook, Bishop's Itchington, Blackwell, Brailes, Bubbenhall, Butlers Marston, Claverdon, Clifford Chambers, Cubbington, Darlingscott, Eathorpe, Earlswood, Ettington, Farnborough, Fenny Compton, Gaydon, Great Alne, Great Wolford, Grey's Mallory, Halford, Hampton Lucy, Hampton Magna / Warwick Parkway, Harbury, Haselor, Hatton Park, Henley-in-Arden, Honington, Ilmington, Kenilworth, Kineton, Kingswood (Lapworth), Ladbroke, Leamington Spa, Leek Wootton, Lighthorne, Lighthorne Heath, Little Compton, Long Compton, Long Marston, Long Marston Airfield, Long Itchington, Lower Shuckburgh, Loxley, Mappleborough Green / East of Redditch, Moreton Morrell, Napton on the Hill, Newbold on Stour, Newbold Pacey, Northend, Norton Lindsey, Offchurch, Oxhill, Pillerton Hersey, Pillerton Priors, Preston on Stour, Priors Hardwick, Priors Marston, Quinton, Radford Semele, Rowington, Salford Priors, Sambourne, Sherbourne, Shipston-on-Stour, Shotteswell, Snitterfield, South of Coventry – Westwood Heath, Southam, Stockton, Stoneleigh, Stratford-on-Avon, Stretton on Fosse, Studley, Tanworth in Arden, Temple Herdewkye, Tiddington, Tredington, Tysoe, Ufton, Ullenhall, Wappenbury, Warmington, Wasperton, Welford-on-Avon, Wellesbourne, Weston under Wetherley, Whichford, Whitnash, Wilmcote, Wood End, Wootton Wawen, Wormleighton.
Figure 20 – Option 5 - Dispersed
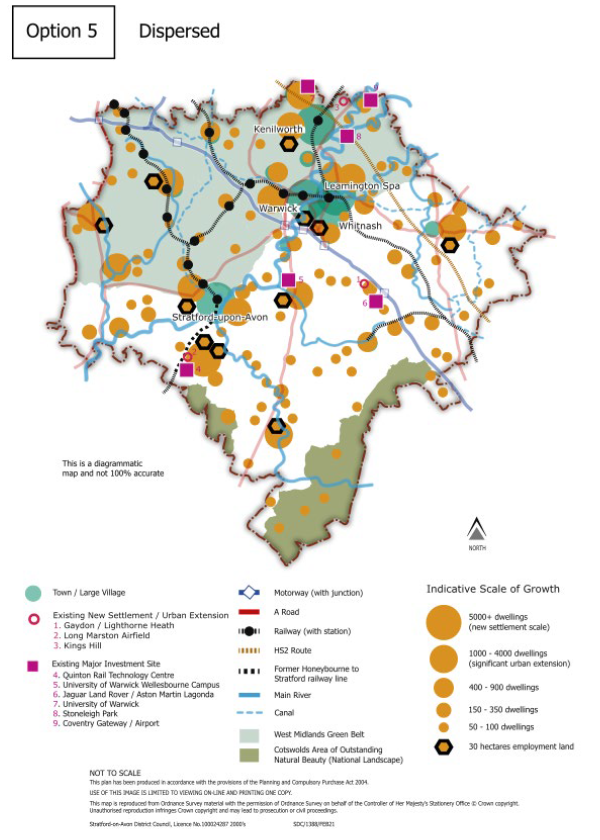
(550)
Q-S7.2: For each growth option, please indicate whether you feel it is an appropriate strategy for South Warwickshire:
Option 1: Rail Corridors
Option 2: Sustainable Travel
Option 3: Economy
Option 4: Sustainable Travel and Economy
Option 5: Dispersed
Issue S8: Small scale development outside of the chosen spatial growth option
Whichever growth option is selected, with a relatively long plan period it is likely that some growth may be appropriate in settlements that fall outside of the chosen growth strategy. Small scale development can play a role in preserving the vitality of smaller settlements, for example by providing additional pupils for the local school, new customers for local facilities, and by helping ensure people can stay living locally when their accommodation needs change.
It is difficult to predict where and when these needs will arise, with a plan period running to 2050. This means that allocating very small sites in a large number of small settlements may not be appropriate.
Current adopted policy
|
Policy document |
Policy reference |
Page no. |
Policy Summary |
|
Stratford-on-Avon District Core Strategy |
CS.10 |
69 |
Limited infilling permitted in Green Belt, where the site is brownfield or within a Local Service Village. |
|
Stratford-on-Avon District Core Strategy |
CS.15 |
83 |
Small-scale community-led schemes permitted within or adjacent to settlements. |
|
Stratford-on-Avon District Core Strategy |
CS.16 |
90 |
The 4 categories of Local Service Villages each have an overall approximate allocation of dwellings in the plan period, with an approximate limit for any individual settlement. Individual sites are not identified. |
|
Stratford-on-Avon District Core Strategy |
AS.10 |
192 |
Small scale housing development permitted within the built up area boundaries of Local Service Villages, or otherwise within the physical confines. Small-scale community-led schemes permitted within or adjacent to settlements. |
|
Warwick District Local Plan |
H1 |
64 |
Housing development permitted within the boundaries of Growth Villages and Limited Infill Villages, or adjacent to urban areas or Growth Villages |
|
Warwick District Local Plan |
H11 |
78 |
Limited infilling permitted in Green Belt Limited Infill Villages, for sites of up to two dwellings, filling a gap in otherwise uninterrupted frontage, and preserving the integrity of the village |
It is expected that limited infill within settlement boundaries will be permitted in the SWLP. This is in line with the approach to infill currently seen in Stratford's policy AS.10 and Warwick's policy H1. This can be seen as the baseline position.
An alternative approach, to allow for slightly more development, would be to specify thresholds under which developments are likely to be acceptable, where they are within or adjacent to existing settlements. This is similar to the approach currently seen in Stratford’s policy CS.16 as regards Local Service Villages. CS.16 allocates a figure for a whole category of Local Service Village; alternatively, this could be applied to individual settlements. In either approach, a size limit would be applied to restrict the amount of development on each individual site. A limit of 10 dwellings or fewer is suggested.
(211)
Q-S8.1: For settlements falling outside the chosen growth strategy, do you think a threshold approach is appropriate, to allow more small-scale developments to come forward?
Q-S8.2: For sites coming forward as part of this threshold approach, what do you think would be an appropriate size limit for individual sites?
Issue S9: Settlement Boundaries and infill development
Settlement boundaries are important, especially in a predominantly rural area such as South Warwickshire. Boundaries help to establish, amongst other aspects of development, where new non-strategic small-scale housing may be appropriate with the confines of existing settlements.
A small but important supply of housing can come from this type of development– often referred to as 'infill' development – and the more that can suitably be achieved in this way can reduce the amount of new growth required outside of existing settlements.
The Plan needs to consider whether any existing settlement boundaries should be altered to take account of a new growth strategy up to 2050. A key aspect of sustainable development in rural areas is locating housing where it will enhance or maintain the vitality of rural communities, and national policy requires plans to identify opportunities for villages to grow and thrive, especially where this will support local services.
In Stratford-on-Avon District, settlement boundaries are not defined for the smallest settlements, except where this has happened individually through Neighbourhood Development Plans. In contrast, the Warwick District Local Plan does define boundaries for smaller settlements.
Current adopted and emerging policy
|
Policy document |
Policy reference |
Page no. |
Policy Summary |
|
Stratford-on-Avon District Core Strategy |
CS15 |
83 |
This policy sets out settlement boundaries on the Policies Map for the main town of Stratford-upon-Avon, the eight Main Rural Centres and two new settlements Gaydon Lighthorne Heath and Long Marston Airfield. Smaller settlements do not have boundaries defined within the Core Strategy. The settlements of Alcester, Bidford-on-Avon, Kineton, Shipston-on-Stour and Wellesbourne have settlement boundaries defined in 'made' Neighbourhood Development Plans which supersede the Core Strategy Policies Map. |
|
Warwick District Local Plan |
H1 |
64 |
This policy sets settlement boundaries for a number of settlements within the District comprising the defined Urban Areas, Growth Villages and Limited Infill Villages. The latter category includes smaller settlements. |
|
Neighbourhood Development Plans (NDPs) |
N/A |
N/A |
A number of made Neighbourhood Development Plans (NDPs) in Stratford-on-Avon District have established Built Up Area Boundaries (BUABs) for their respective areas. |
|
Stratford-on-Avon District emerging Site Allocations Plan (SAP) |
SAP.8 |
64 |
Built Up Area Boundaries (BUABs) are defined for Local Service Villages where these do not already have a BUAB in a made or well-advanced NDP. The BUAB for Southam is also revised. Boundaries are not defined for the smallest settlements. |
(198) Q-S9: Please select the option which is most appropriate for South Warwickshire
The SWLP team consider that it would not be appropriate to revise the extent of existing boundaries, without also addressing which settlements have boundaries. Such an approach would have the same disadvantage as option S9b, above, but without addressing the underlying inconsistency between the two Councils. For this reason, it has not been presented as an option within this consultation.
Issue S10: Any other development strategy issues
(1297) Q-S10: Please add any comments you wish to make about the development distribution strategy for South Warwickshire